Servo Motor Position Control Speed Operation Plan

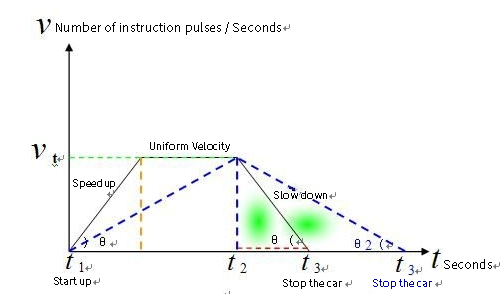
1、This diagram is the Servo Motor position control speed operation planning chart, the map of each point on the height of the motor speed at this time;
2、This diagram is not a motion control trajectory diagram;
3、The Servo Motor Position Control Velocity Diagram describes the position control process, Servo Motor from start, acceleration, uniform speed, deceleration, stop several running speed parts, complete a position control process。
4、In a position control process of Servo Motor, starting and stopping with power on is a continuous rotating process, not pulse stepping forward. The feedback pulse of encoder only records the speed and angular displacement of the motor;
5、Servo Motor Start Instruction, acceleration instruction, Deceleration Instruction, Stop Instruction, is the PLC counter, the comparator operation obtains;
6、For example: Instruction Pulse number-encoder Feedback Pulse number/electronic gear ratio = 0, PLC Output Stop Command, frequency control mechanism to complete the brake stop!
7、Therefore, we do not think that the PLC pulse motor rotation, do not turn, fast forward to turn fast, slow forward to turn slow, as if the PLC pulse control motor rotation;

8、The speed V unit of Servo Motor is: Instruction Pulse Number/second, or: encoder feedback pulse number/electronic gear ratio second;
9、The area around the velocity curve = the number of instruction pulses = the pulse number of Encoder feedback/electronic gear ratio;
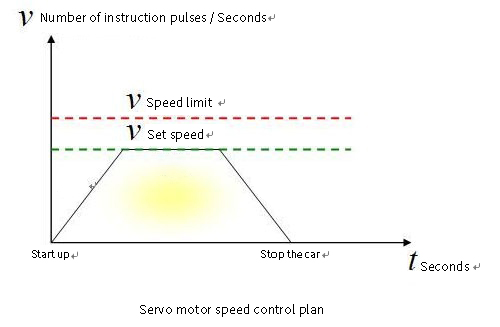
10、The upper limit of servo motor speed can be calculated, the upper limit of motor speed (r/s) weekly instruction pulse number = Plc Count Pulse rated frequency;
11、The upper limit of servo motor speed can be calculated, the upper limit of motor speed (r/s) = PLC count pulse rated frequency electronic gear ratio/encoder resolution;
12、Servo motor speed can be set, must be less than the upper limit speed, that is motor speed (r/s) < PLC count pulse rated frequency/cycle instruction pulse number;
13、Servo motor speed is not set, also can default to electronic gear ratio, encoder resolution, PLC count pulse rated frequency to determine the upper limit speed;
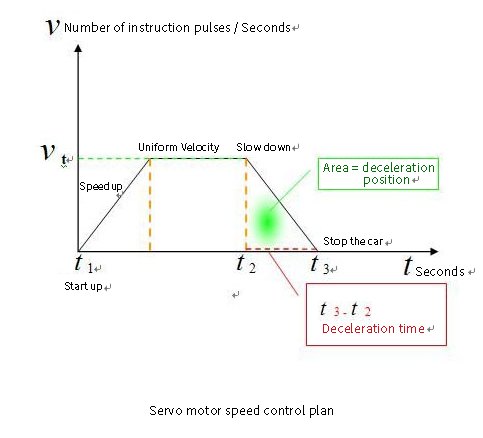
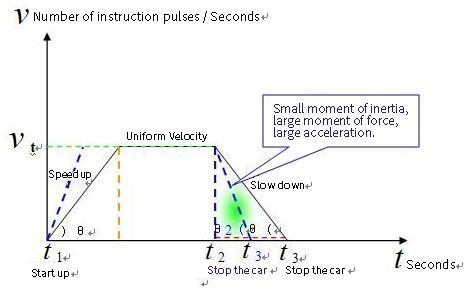
14、Area of the triangle below the deceleration curve = Deceleration Position;
15、 T 3-t 2 is the deceleration time;
16、Acceleration and deceleration time setting and frequency converter the same;

17、Here's how the load torque changes as the system runs:
1)During servo constant speed running, load torque = system Friction Torque;
2)During servo acceleration and deceleration operation, load moment = system friction moment, inertia moment, acceleration moment;
3)During servo operation, the load is large during acceleration and deceleration, and small during constant speed operation;

18、Here is the system running motor current, torque changes:
1)During servo constant speed running, motor running torque = load Torque = System Friction Torque;
2)During servo acceleration and deceleration operation, motor running torque = load torque = system friction torque, inertia torque and acceleration torque;
3)Servo Operation Period: During Acceleration and deceleration period, the load is big, the Motor Operation Torque is big, the current is big;

19、Here is how to select the motor parameters of the servo system:
1)Safe Choice:
The current is less than the rated current and the Torque is less than the rated Torque, the current is equal to the rated current and the Torque is equal to the rated torque;
2)Allow overload selection:
The current is equal to the rated current and the Torque is equal to the rated Torque, the current is greater than the rated current and the Torque is greater than the rated torque;
3)Unsafe do not choose law:
The current is more than the rated current overload and the Torque is more than the rated torque overload, the current is more than the rated current, the Torque is more than the rated torque and the motor is burned up by over-heat;
20、System acceleration during acceleration and deceleration:
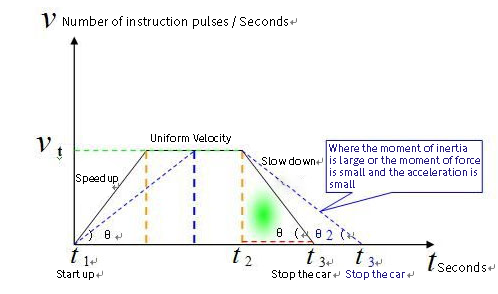
1)System acceleration = slope tg of acceleration and deceleration curve during Motor Acceleration and deceleration;
2)During the acceleration and deceleration of the motor system acceleration = inertia acceleration moment/inertia, proportional to the inertia acceleration moment, and inversely proportional to the system inertia;
3)As shown in FIG. , The blue curve represents the acceleration curve with small moment of acceleration or large inertia and small acceleration;
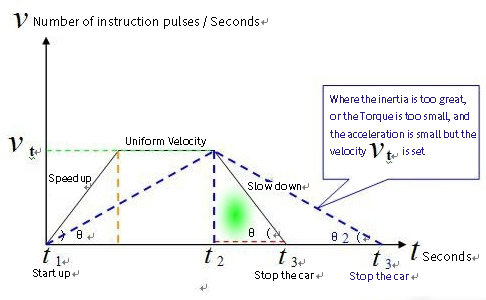
4)As shown in figure, the Blue Curve represents the acceleration Torque is too small or the inertia is too large, the acceleration is too small curve, but the maximum speed can reach the set speed;

5)As shown in fig. , The blue curve represents the acceleration curve with large acceleration moment or small inertia and large acceleration;
21、Talk about the amount of advance of the servo motions deceleration position:
1)Running speed Vt is big, Servo motion decelerates the position to advance the quantity to be big, as shown in fig. , VT2 is bigger than VT1, decelerates the position to advance the quantity triangle area to be different;
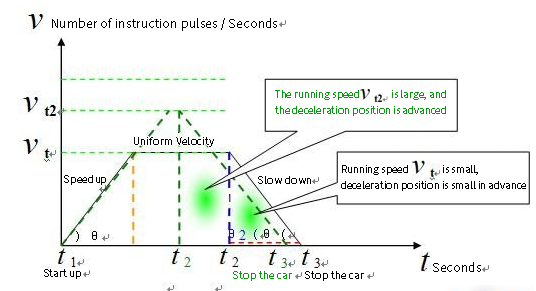
2)Large Inertia or moment, small acceleration, Big Delta area of deceleration advance, small inertia or moment, big acceleration, small Delta area of deceleration advance;
3)The above 94th floor and 95th floor show that the advance of Servo motion deceleration position is related to the following factors:
①Running speed
②System Inertia
③Acceleration Torque
4)So servo motion deceleration position ahead of the magnitude, is not a fixed number, because the Servo parameters are different and different;
5)The conclusion is consistent with the conclusion of my previous debate! The formula is the same!
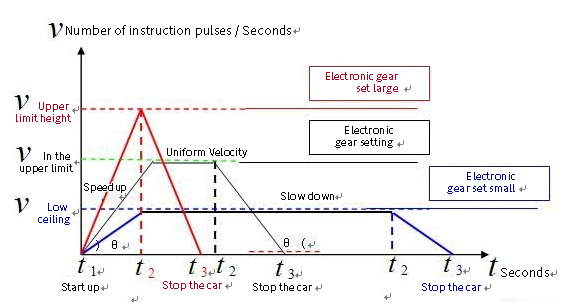
21、Here's how a Servo system with a high-resolution encoder works over a three-year period with an electronic gear ratio set to a high, medium, and low speed graph:
1)Servo system equipped with high resolution encoder, electronic gear ratio is equal to 1, or less than 1, motor operating speed limit is low, motor can only run at low speed, otherwise encoder feedback pulse deformation counting error, Servo position control failure, as shown in the Blue Curve;
2)The servo system equipped with high-resolution encoder, in order to meet the need of processing speed, the electronic gear ratio is set larger than 1, the upper limit of motor running speed is greatly increased, but the resolution of encoder can not be fully utilized, is a waste, as shown in figure black curve;
3)The servo system equipped with high-resolution encoder, in order to meet the needs of high-speed processing, the electronic gear ratio is set very high, the motor running speed upper limit is very high, when the resolution of the encoder reduced to low-resolution, low-resolution, great waste, as shown in the Red Curve;
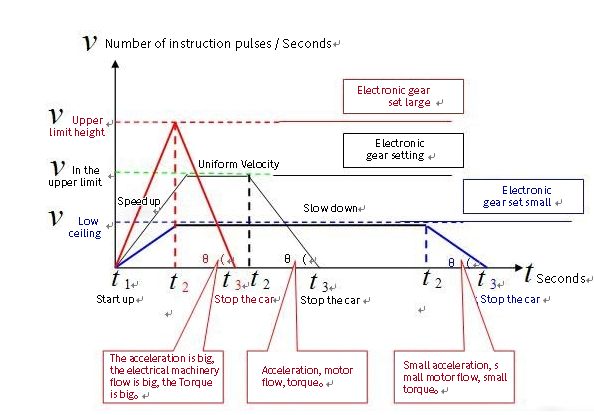
4)Electronic gear ratio is small, motor running at low speed, motor acceleration and deceleration acceleration is small, motor acceleration and deceleration current small Torque, such as the Blue Curve;
5)Electronic gear ratio, motor running at medium speed, motor acceleration and deceleration, motor acceleration and deceleration current Torque, as shown in figure black curve;
6)Electronic gear ratio, motor high-speed operation, motor acceleration and deceleration acceleration, motor acceleration and deceleration current large Torque, as shown in the Red Curve;
7)In the same system, the inertia is constant, and the running speed is different because of the different setting of the electronic gear ratio, the acceleration and deceleration acceleration, the working current of the motor and the running power are different
8)In the same system, the inertia is constant, because the running electronic gear ratio is high, the system running speed is high, the acceleration and deceleration acceleration is high, the motor working current is high, the running power is big, this time is not the inertia overload, such as the Red Curve;
22、Here's the so-called 'Inertia overload' problem:
1)In the same system, as the load inertia increases, the acceleration and deceleration will decrease a lot, the running acceleration and deceleration time will be dragged long, after the acceleration is almost complete, the deceleration motion will start without constant motion, and the running time will be dragged very long, as shown in the blue curve, you can simply say inertia overload;
2)The same curve, may also be due to motor rated torque small rated power small selection, resulting in such as the blue curve in the case of overload, that is called Motor Selection Small Motor;
3)This depends on the background of this curve, in order to say is the inertia overload, or motor selection small problem!